
ProXlab is a browser based app for PRO-Line instruments.
Measurement curves are easier to work with when logger readout, live collection and export sit in one clear PC-based workflow.
This browser based HTML app extends the PRO-Line interface for logger instruments and for compact data acquisition tasks, helping users collect and document measured values without a separate acquisition system.
Logger data can be read from single-value and continuous .json files (Instrument off), while live data collection is available via USB-COM-Port (Instrument on).
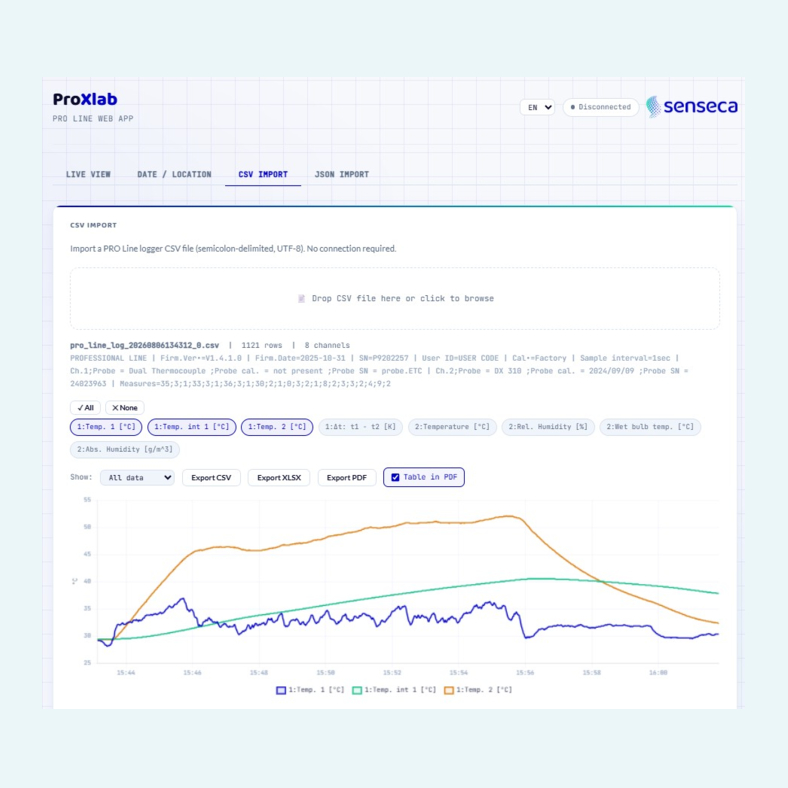
The app displays measured values graphically, which makes curves easier to check before they are exported.
For reporting and further analysis, measurement data can be exported as PDF, .xlsx or .csv.
Measurement location labels and clock settings can also be read out and edited, supporting clearer assignment of data to the correct measuring point.
Access is provided via download link for the app.


The app reads single-value logger data and continuous logger data from .json files generated by supported PRO-Line logger instruments.
Measurement values can be collected live on a PC via USB-COM-Port when using the PRO-Line interface.
Measurement curves are shown graphically in the app for visual checking and documentation work.
Recorded or imported measurement data can be exported as PDF, .xlsx or .csv for use in reports, spreadsheets or further processing.
The app reads out measurement location labels and provides editing functions for assigning data to measuring points.
The software is made accessible via a download link for the app.
========================================================================
Senseca PRO Line - Connectivity Toolset
ProXlab Web App V1.5 | Release Candidate 1 (RC1_2027-07)
========================================================================
General info -> See README_SHARED_EN.txt in the package root
------------------------------------------------------------------------
REQUIREMENTS
------------------------------------------------------------------------
Chrome 89+ or Edge 89+ (Web Serial API)
No installation - pure HTML file, USB driver required
------------------------------------------------------------------------
EXECUTION
------------------------------------------------------------------------
1. Open ProXlab.html in Chrome/Edge.
2. Connect -> select COM port.
3. Start Discover.
4. Tab "Clock / Measuring Points" for clock and measuring-point names.
5. "Sync Device with PC (UTC)" sets the device clock to PC time in one step.
------------------------------------------------------------------------
AUTO-POLL
------------------------------------------------------------------------
Auto-Poll starts on its own once the box is ticked - after a port scan and
after a manual "Poll Now". The checkbox does not have to be re-toggled.
Ticking it before any discovery is fine: polling begins after the next scan.
It never runs twice in parallel; the interval is armed only once.
------------------------------------------------------------------------
DISPLAY AND DETECTION
------------------------------------------------------------------------
Internal sensors (port 0: battery voltage, device temperature) are NOT
discovered or displayed by default. Enable them with the checkbox
"Include Internal Sensors" under Advanced, then run Discover again.
Channels are labelled "<port>: <name>" (e.g. "1: Temp [degC]"), matching
the way the device itself labels its channels.
Export format follows the language selector: EN uses yyyy-MM-dd and "."
as decimal separator, DE/FR/IT/ES use dd.MM.yyyy and "," (list separator
";"). XLSX keeps numeric cells as real numbers.
The whole interface is localised - all four tabs, their explanation texts,
buttons and drop-down entries, plus the disclaimer in the footer.
------------------------------------------------------------------------
CHART SIZE LIMIT (CSV / JSON IMPORT)
------------------------------------------------------------------------
Chart.js has no hard limit; it simply gets linearly slower, so a very large
file looks like a frozen browser tab rather than an error. Measured with the
configuration this dashboard uses:
240,000 points -> ~1.5 s 1,600,000 points -> ~8 s
800,000 points -> ~3.8 s 3,200,000 points -> ~16 s
The chart is therefore capped at 1,600,000 points (about 8 s redraw on the
reference machine). Above that a notice appears instead of the chart.
IMPORTANT: the load is rows x SELECTED channels, not rows alone - 800,000
rows with 4 channels are 3,200,000 points. To display a large file, narrow
the range under "Show:" or select fewer channels. The data table and all
exports are never capped and always contain every row.
To raise the cap, edit MAX_CHART_POINTS near the top of the script block.
------------------------------------------------------------------------
ERROR HANDLING
------------------------------------------------------------------------
Errors appear in the log area; reconnect after timeout.
------------------------------------------------------------------------
DISCLAIMER
------------------------------------------------------------------------
Without warranty. Adaptations may be required. Freely usable. No support claim.
------------------------------------------------------------------------
CONTACT
------------------------------------------------------------------------
Senseca Germany GmbH - Portable Measurement
Hans-Sachs-Strasse 26, 93128 Regenstauf, GERMANY
E-Mail: info.regenstauf@senseca.com
========================================================================
(c) Senseca Germany GmbH - Portable Measurement | RC1_2027-07
========================================================================
Contains README files.