Environmental noise projects demand more than data download. NS-ENS gives acousticians a dedicated desktop workspace to archive, view, post-process and report measurement data from Senseca sound level meters, with the flexibility needed for local regulations alignment and complex acoustic phenomena.
The module handles long time profiles, frequency multi-spectra, level statistical distributions and spectrograms with advanced graphics, zoom tools, cursors and multi-monitor support. Thanks to dedicated algorithms, users can identify and quantify sound sources, events, tonal and impulsive components, then calculate descriptors by period such as day, evening and night. Customizable legislation settings, acoustic zoning areas and noise limits help adapt each project to the required assessment framework.
Data from XPT800, XPT801 and selected HD2XXX series sound level meters can be accessed through NS-Storage, downloaded locally and analyzed in a project structure. Reporting is built around customizable Microsoft Word® templates, with export to Word®, PDF, HTML and Json.


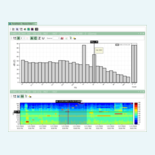
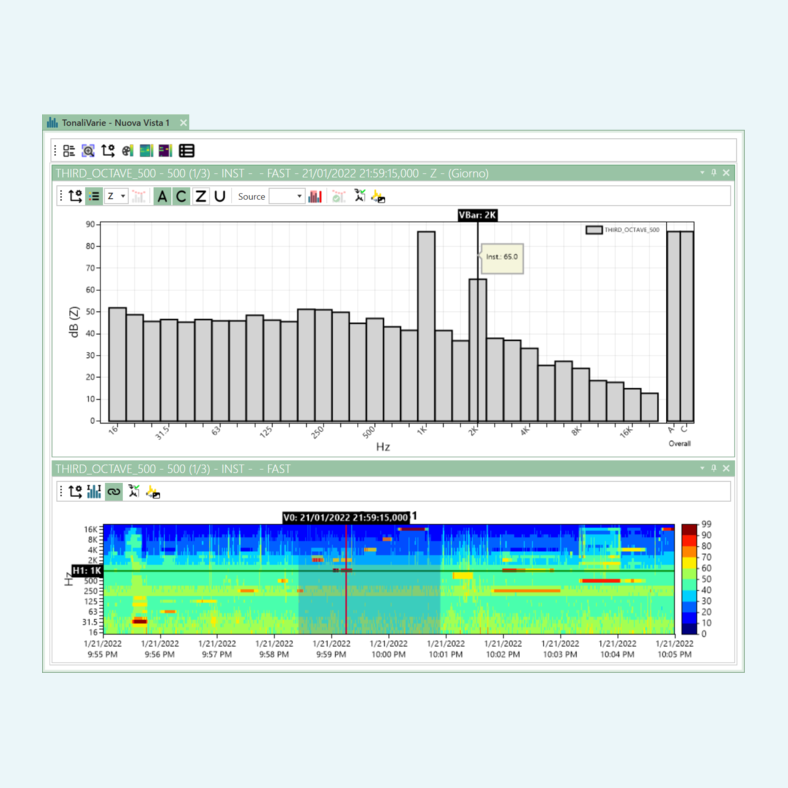
The software displays level vs time, level vs frequency, spectrograms, broad-band and spectral distributions, broad-band and spectral statistics vs time, and table views.
Multiple vertical and horizontal cursors with time and level readouts. Leq calculation between vertical cursors, level difference between horizontal cursors, precise positioning via date/time input or keyboard, snap-to-plot and auto-centering, plus cursor synchronization (center cursor on plot or plot on cursor).
Advanced analysis of sound pressure levels over time and frequency, including running Leq calculations, period-based indicators (Day, Evening, Night, Ld, Le, Ln, Lden, Ldn), and sound source creation, management and analysis. Automatic or manual event detection by time, threshold or duration, with event statistics, synchronized plots, editing and masking. Impulsive and tonal component detection according to relevant standards, including occurrence lists and correction factors. Broadband and frequency-band statistical analysis with Ln percentiles, level distributions and time trends. Synchronized audio playback (XPT80x) and maximum annoyance period evaluation.
Statistical analysis of sound levels and sound sources with level and cumulative distributions, customizable time-based statistics, Ln percentiles for broadband and spectral bands, time/frequency trend analysis, and identification of maximum and minimum annoyance periods using configurable sliding windows.
Automatic identification and analysis of tonal components according to D.M. 16/03/1998 and ISO 1996-2:2017. Detection is based on 1/3-octave band analysis with configurable thresholds and comparison with adjacent bands. Includes tonal component mapping, ISO 226 isophone comparison, and automatic application of correction factors (penalties) as required by the selected standard.
Automatic impulsive noise identification using a configurable detection algorithm. Interactive analysis of detected events with occurrence lists, period-based statistics, configurable time-window distribution, and graphical visualization. Automatic calculation of applicable correction factors (penalties) according to relevant regulations.
Automatic reporting with customizable Microsoft Word® templates and tags, report preview, and export to Word®, PDF, HTML and JSON. Includes management of customers, staff, instrumentation, pre/post measurement calibration values, and environmental conditions.
NS-ENS Environmental Noise Studio - Desktop software module for advanced environmental noise analysis