
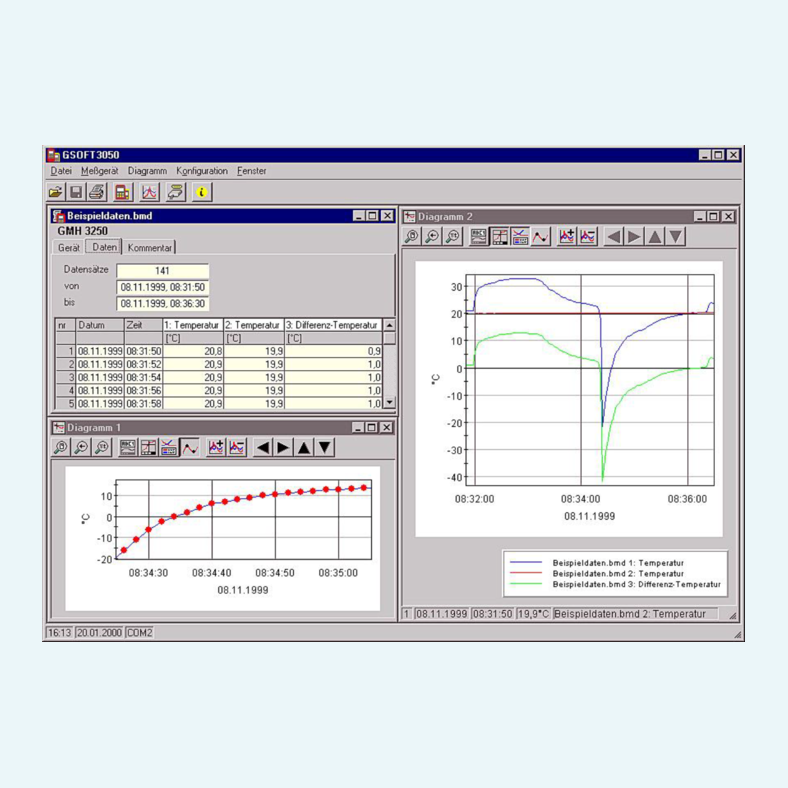
Field measurements become more useful when recorded values can be checked, documented and shared without extra manual work. This Windows operating software reads the data logger functions of GMH 3000, GMH 5000 and GHMsilverline handheld instruments and displays measurements as tables or diagrams.
The software supports daily evaluation tasks with practical tools: logger recordings can be started, stopped and read in, measurement data can be saved for later analysis, and diagrams can show up to two different units with up to 15 graphs per unit. Zoom, cursor, legend and data label functions help users inspect individual measuring points more closely.
For documentation and further processing, files can be exported as ASCII text, table data and diagrams can be copied to the clipboard, and selected data windows or diagrams can be printed. Calibration history can also be loaded from compatible instruments and saved as a text file.


The software searches for connected measuring instruments via the selected interface and opens each detected instrument in a separate window.
Users can start new logger recordings, stop cyclic recordings, read stored measurements and clear logger data through menu or toolbar functions.
Supported instruments can use manual recording, cyclic logger operation or deactivated logger mode, depending on the selected setup.
Measurement tables, comments, instrument information, alarm information and recordings are organized in separate registers.
Measurement diagrams support selectable graphs, two Y-axes for different units, zoom functions, cursor display, legends and data labels.
Saved logger data and complete screen views can be reopened for later viewing or analysis.
The selected logger data window or diagram can be printed when a printer is installed on the computer.
Update from program version 2.6 onwards.
Important note:
This update requires a fully installed version!
Older full versions (below 2.6) cannot be installed on newer systems.
If you have an older full version, please request a paid update CD to install the software on current operating systems.