
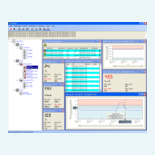
On-site readings and distributed bus systems are easier to evaluate when every channel is visible in one place. EBS records measuring data from EASYBus systems and GMH handheld instruments for small measuring systems, process and system control, climate monitoring and building monitoring.
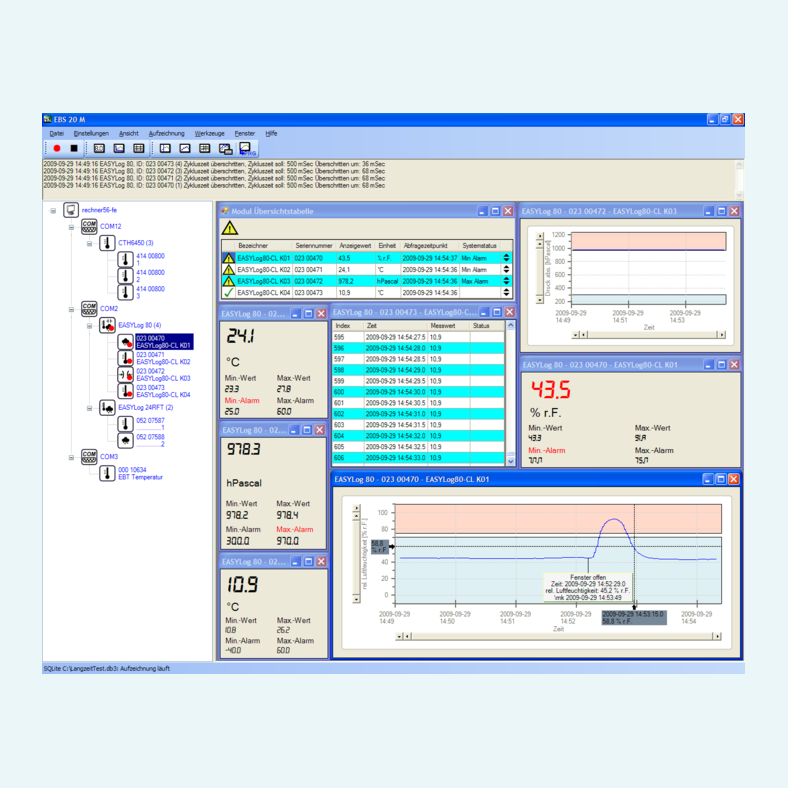
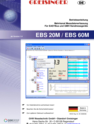
The software helps users move quickly from installation to logging. It can display up to 20 modules with EBS 20M or up to 60 modules with EBS 60M, and the recording interval can be set individually for each channel from 500 ms. Current values, error and status information are shown during recording, with scalable diagrams, alarm boundaries, measuring points, cursor functions and data labels for detailed review.
Recorded data is stored in a SQLite database that the software installs and administers without requiring database knowledge. Several interfaces and different interface converters can be used at the same time, allowing EASYBus modules and GMH handheld instruments to run in one program.


The software works with EASYBus modules and GMH handheld instruments via selectable COM or USB interface converters, including simultaneous use of several interfaces.
COM interfaces, bus systems, connected modules and recording settings are managed from the navigation panel using context menus.
Recorded data can be displayed as charts with zoom, cursor, grid lines, legends, measuring point symbols and picture or data export functions.
Recorded measuring values, time stamps and system status are shown in a table, with status information displayed in clear text.
Existing databases can be loaded for chart or table display, including multiple curves in one chart and up to 2 Y-axis with different units.
Export settings include column separator, string separator, Windows or clear text time format and optional data compression.
Optional Windows-account authentication can protect security-relevant actions such as stopping an active recording.

Important note:
This internet update requires that you already have the paid software EBS 20M / EBS 60M, version v1.0 or higher, installed.
System requirements:
Windows 7 SP1 or later (32 or 64 Bit Edition).
Not compatible with Windows RT, Windows 10 in S mode, or ARM or Intel Itanium based Windows systems.